Finally understand statistics — not just survive it
A rigorous, college-level statistics course taught by a patient AI professor who explains the "why" behind every formula — from descriptive stats and probability all the way through regression and hypothesis testing, in plain English you'll actually remember.

"I don't want you to remember the formula — I want you to understand it well enough that you could explain it to someone else at 11pm before an exam."
— AI Professor Courses
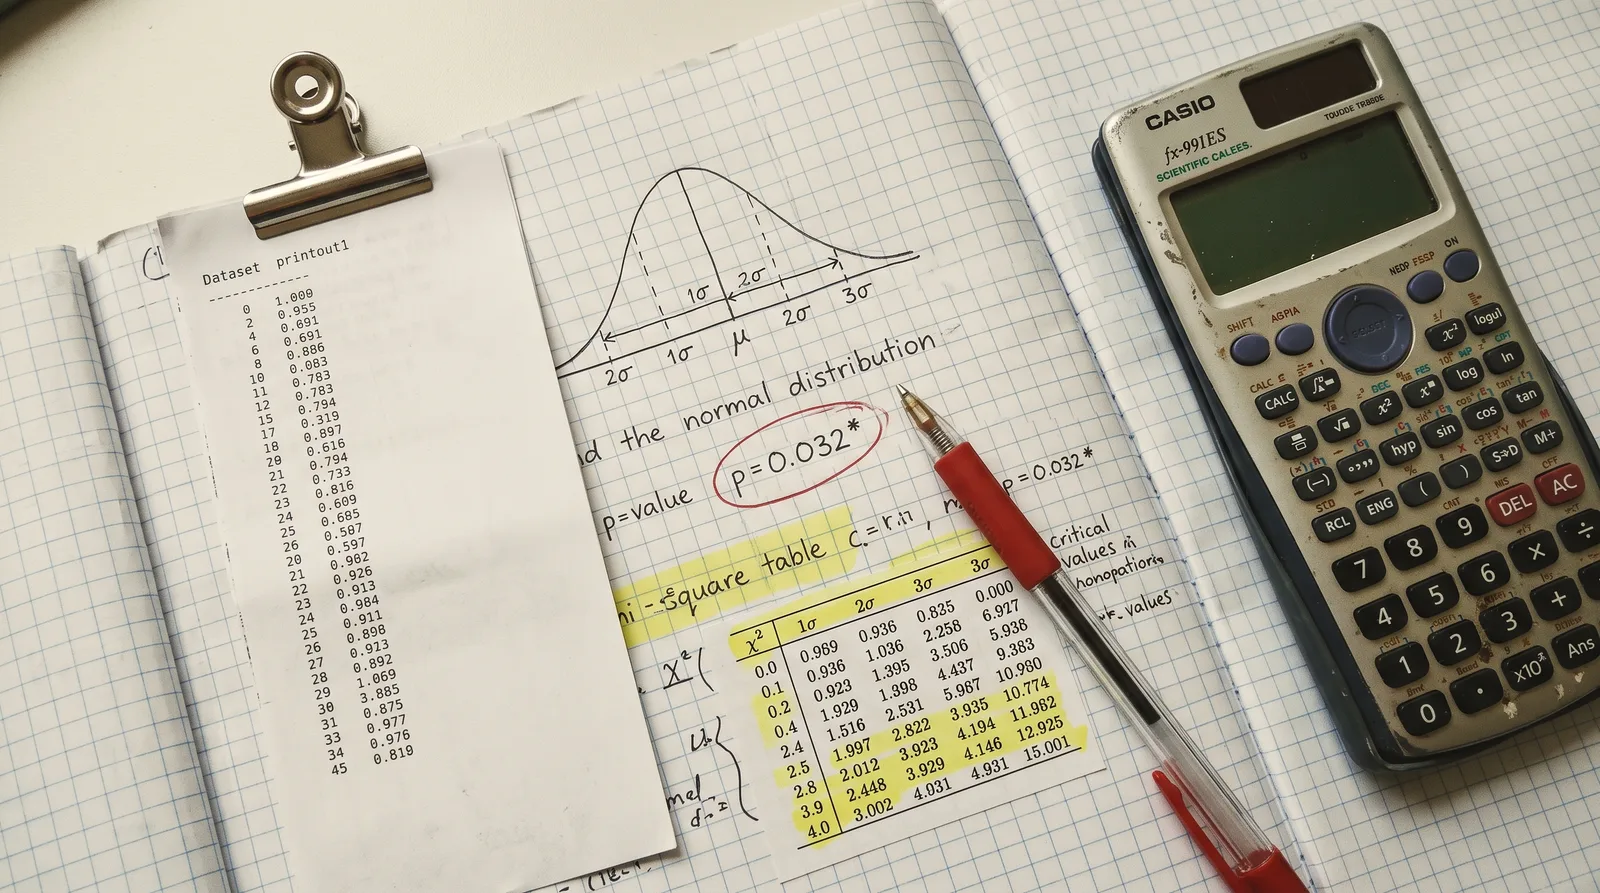
What you'll learn
What you'll be able to do
- Interpret and report descriptive statistics — mean, median, variance, and standard deviation — for any real-world dataset
- Apply probability rules and distributions (normal, binomial, t) to calculate meaningful likelihoods and expectations
- Design and evaluate hypothesis tests, correctly choosing between z-tests, t-tests, chi-square, and ANOVA
- Construct and interpret confidence intervals to communicate uncertainty with precision
- Build and diagnose simple and multiple linear regression models, checking assumptions and spotting violations
- Read and critically evaluate statistical claims in research papers, news articles, and business reports
How it works
A school that adapts to you
This isn't a set of static videos. Every lesson is generated live and tuned to where you actually are.
We learn your level
A quick placement check tailors your starting point so you're never bored or lost.
Lessons adapt as you go
Each lesson is written for your pace and your goal, adjusting as your skills grow.
Your AI coach keeps you moving
Checkpoints, feedback, and gentle nudges turn progress into a real result.
The curriculum
What's inside your school
6 modules · 28 lessons

Descriptive Statistics & Data Literacy
Build the foundation by summarizing, visualizing, and critically interpreting real-world datasets using core descriptive measures.
- 1.1Types of Data & VariablesIncluded
- 1.2Measures of Center: Mean, Median & ModeIncluded
- 1.3Measures of Spread: Variance & Standard DeviationIncluded
- 1.4Visualizing Data: Charts, Histograms & BoxplotsIncluded
- 1.5Spotting Misleading StatisticsIncluded
Probability & Distributions
Develop intuition for chance and master the key probability distributions that underpin all of inferential statistics.
- 2.1Probability Rules & CountingIncluded
- 2.2Conditional Probability & IndependenceIncluded
- 2.3The Binomial DistributionIncluded
- 2.4The Normal Distribution & the Empirical RuleIncluded
- 2.5Sampling Distributions & the Central Limit TheoremIncluded
Confidence Intervals
Learn to estimate population parameters from sample data and communicate uncertainty with precision using confidence intervals.
- 3.1The Logic of Estimation & Margin of ErrorIncluded
- 3.2Confidence Intervals for a Mean (z and t)Included
- 3.3Confidence Intervals for a ProportionIncluded
- 3.4Sample Size & PrecisionIncluded
Hypothesis Testing
Master the full hypothesis-testing framework — from setting up competing hypotheses to choosing the right test and interpreting p-values correctly.
- 4.1The Logic of Hypothesis TestingIncluded
- 4.2One-Sample z-Tests and t-TestsIncluded
- 4.3Two-Sample and Paired t-TestsIncluded
- 4.4Chi-Square Tests for Categorical DataIncluded
- 4.5One-Way ANOVAIncluded
- 4.6p-Values, Effect Size & Statistical vs. Practical SignificanceIncluded
Correlation & Linear Regression
Build, interpret, and diagnose simple and multiple linear regression models to uncover and quantify relationships in data.
- 5.1Scatterplots & CorrelationIncluded
- 5.2Simple Linear RegressionIncluded
- 5.3Evaluating Model Fit: R² and ResidualsIncluded
- 5.4Regression Assumptions & DiagnosticsIncluded
- 5.5Introduction to Multiple Linear RegressionIncluded
Reading & Evaluating Statistical Claims
Apply every skill from the course to critically assess statistical evidence in research papers, business reports, and media.
- 6.1How to Read a Statistics Section in a Research PaperIncluded
- 6.2Common Statistical Errors & Logical FallaciesIncluded
- 6.3Evaluating Statistics in the News & Business ReportsIncluded
Who it's for
Is this you?

The struggling undergrad
Enrolled in a required stats course that moved too fast, she needs the conceptual grounding her lectures skipped over.

The graduate student
Facing a quantitative methods requirement or dissertation data analysis, he needs rigorous inference skills — fast and without gaps.

The data-adjacent professional
She sits in meetings full of regression outputs and p-values and is done nodding along — she wants to actually understand what the numbers mean.
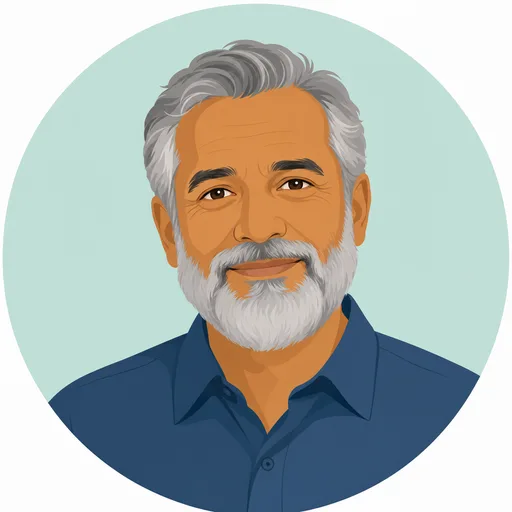
The lifelong learner
Intellectually curious and retired, he has always wanted a real grasp of statistics and finally has the time to do it properly.

The career switcher
Moving into data analytics or research, she needs a credible statistics foundation before diving into tools like Python or R.

The self-taught analyst
He learned stats piecemeal through tutorials and Stack Overflow and needs to fill in the conceptual holes before they become professional liabilities.
Questions
Frequently asked
Your teacher
A note from your teacher
AI Professor Courses
If you've ever sat in a statistics class and thought, "I can follow the steps, but I have no idea what I'm actually doing" — I want you to know that's not a you problem. That's a teaching problem. And it's exactly why I built The Stat Professor.
Statistics is one of those subjects where the traditional approach — here's the formula, plug in the numbers, memorize the decision rule — produces students who can pass a problem set and then freeze the moment the real world asks them a question that doesn't match the template. I've seen it happen too many times. Students who could calculate a t-statistic but couldn't tell you what it meant. Professionals who could run a regression but had no idea whether to trust the output. That gap between mechanical execution and genuine understanding is what I am here to close.
What you'll find in this school is the course I wish existed when I was first learning statistics — and the course I've spent years refining in practice. We start with what data actually is and how to describe it honestly, because you cannot build good statistical reasoning on a shaky foundation. We move carefully through probability and distributions, because the Central Limit Theorem isn't a technicality — it's the reason inference works at all. Then we get into confidence intervals and hypothesis testing, where I slow down and make sure you understand not just how to run a test, but what question it's answering, what assumptions it requires, and what the result does and does not allow you to conclude. We finish with regression and, importantly, the skill of reading statistics critically in research papers, news articles, and business reports — because knowing how to evaluate a statistical claim is just as valuable as knowing how to make one.
I also believe, deeply, that there are no dumb questions in statistics. Some of the most important questions — "But why can't I just use a t-test here?" or "What does it mean for something to be statistically significant but not practically significant?" — are the ones students are often afraid to ask. In this school, those are exactly the questions I want. Ask them in the community. Push back on explanations that don't quite land. That's how this works.
Whether you're fighting through a required course, preparing for graduate work, or trying to hold your own in data-driven meetings at work, you belong here. Come in curious, and I promise you'll leave capable.
— AI Professor Courses
Start your journey today
Get instant access — learn at your own pace with an AI coach in your corner.
$5/mo
Recurring billing · cancel anytime
Secure checkout · Instant access
- 6 modules, 28 lessons
- AI-adaptive lessons tuned to your level
- Quizzes & checkpoints to lock in progress
- Your own AI learning coach
- Learn on any device, at your pace
- Full access for as long as you're subscribed